Hello everyone,
I am working on an economics assignment and need to plot several graphs without need for specifying X or Y axis values. The graph should be able to represent the economic concept behind the math. Is any chance I could do that easily using Inkscape? Any idea?
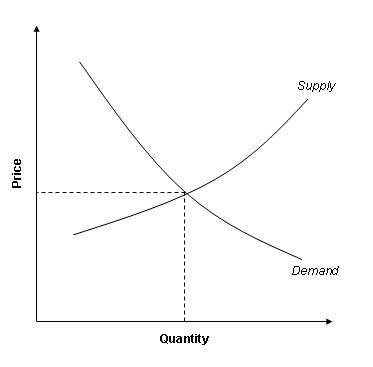
An example of graph is:
http://www.mikeonads.com/wp-content/upl ... and_11.JPG
many thanks
design free functions
Re: design free functions
Are you asking if there is an automated way to do it? Like input the mathematical formula and Inkscape draws the graph? Not that I know of. But one certainly could draw the graph "by hand" using Inkscape. I think I might be missing your meaning.... 
Basics - Help menu > Tutorials
Manual - Inkscape: Guide to a Vector Drawing Program
Inkscape Community - Inkscape FAQ - Gallery
Inkscape for Cutting Design
Manual - Inkscape: Guide to a Vector Drawing Program
Inkscape Community - Inkscape FAQ - Gallery
Inkscape for Cutting Design
Re: design free functions
I assume you want to just draw graphs like this. I am thinking you don;t want to have to create the X/Y values to plot the graphs in a spreadsheet type program.
Here is a quick version I did in 5 mins:

So I hope that answers your question (yes - you can).
-Rob A>
Here is a quick version I did in 5 mins:
So I hope that answers your question (yes - you can).
-Rob A>
