Generate a normal (gaussian) distribution

Post questions on how to use or achieve an effect in Inkscape.
santoshamb
Posts: 2
Joined: Thu Jun 23, 2016 5:00 am

Generate a normal (gaussian) distribution

Postby santoshamb » Thu Jun 23, 2016 5:15 am

Hello,

I'd like to draw a normal distribution (https://en.wikipedia.org/wiki/Normal_distribution) within inkscape.

I've attempted to use the Parametric Curves tool but I don't seem to be using it correctly. Here is what I've tried:

Screen Shot 2016-06-22 at 3.07.50 PM.png
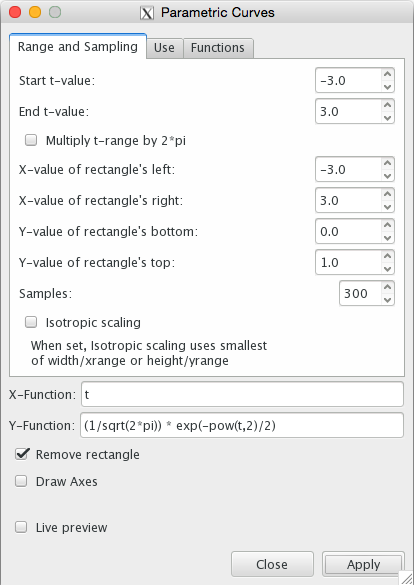
Screenshot of Parametric Curves Parameters
Screen Shot 2016-06-22 at 3.07.50 PM.png (51.99 KiB) Viewed 6477 times


And this is what I end up with:

Screen Shot 2016-06-22 at 3.09.55 PM.png
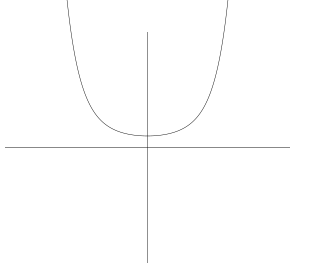
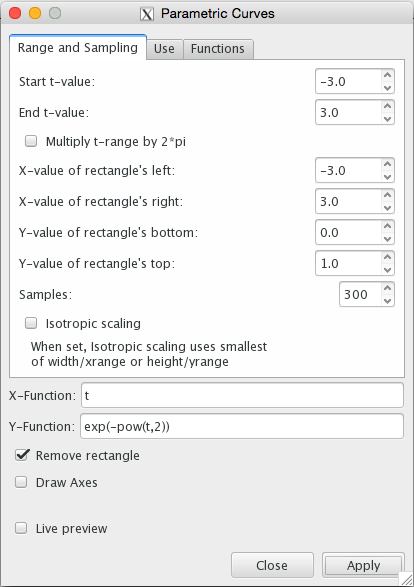
Result of Parametric Curves function
Screen Shot 2016-06-22 at 3.09.55 PM.png (6.12 KiB) Viewed 6477 times


Can anyone tell me what I'm doing wrong?

Also, is there documentation for this function anywhere? The best I can find is pretty sparse: http://tavmjong.free.fr/INKSCAPE/MANUAL ... ender.html

User avatar
druban
Posts: 1917
Joined: Fri Nov 20, 2009 10:48 pm

Re: Generate a normal (gaussian) distribution

Postby druban » Thu Jun 23, 2016 6:36 am

Offhand you are missing the e and the negative is on the wrong 2, it should be negative one half
Your mind is what you think it is.

santoshamb
Posts: 2
Joined: Thu Jun 23, 2016 5:00 am

Re: Generate a normal (gaussian) distribution

Postby santoshamb » Fri Jun 24, 2016 4:06 am

Hi Druban,

Thanks a lot for the reply, I really appreciate it.

exp(t) is the same as e^t, so there isn't an e missing. Also, x/2 is the same as 1/2 * x, so the 2 is fine. However, you are right about the negative, it should be outside the exponent. This is why my function was increasing and not decaying as |t| increased.

For anybody stumbling upon this post, here is the formula (with some updated settings to isolate the curve).

Screen Shot 2016-06-23 at 1.57.17 PM.png
Settings for standard normal distribution
Screen Shot 2016-06-23 at 1.57.17 PM.png (52.02 KiB) Viewed 6398 times


This makes the following curve:

Screen Shot 2016-06-23 at 1.59.51 PM.png
Standard normal distribution
Screen Shot 2016-06-23 at 1.59.51 PM.png (2.79 KiB) Viewed 6398 times


From here you can also add standard deviation if you want to stretch it.

If all you want is the bell shape, you don't need the complete formula. The first part (1/sqrt(2*pi) just ensures that the area under the curve = 1, while the dividing by 2 just ensures that variance is 1. But if all you want is a visual, you can enter a simpler formula.

Screen Shot 2016-06-23 at 2.03.20 PM.png
Settings for bell curve
Screen Shot 2016-06-23 at 2.03.20 PM.png (51.24 KiB) Viewed 6398 times


Return to “Help with using Inkscape”