Hi everybody,
currently i'm trying to import a PDF (Created with pythons matplotlib) showing a very pixelated version of a 2D gaussian distriution (I put that PDF into the attachment).
The problem i have is the following: I used this rough resolution on purpose. If I now import the
PDF, Inkscape always uses its gradient mesh approximation and smoothes out the distribution
(Even with precision set to 1.0)!
My question now is: Is there a way to disable this "gradient mesh approximation" feature!?
Cheers
Disable gradient mesh approximation on PDF input
-
HelloWorld
- Posts: 3
- Joined: Sun Mar 27, 2016 4:02 am
Disable gradient mesh approximation on PDF input
- Attachments
-
- vmi_initial_cartesian.pdf
- (163.64 KiB) Downloaded 203 times
Re: Disable gradient mesh approximation on PDF input
Hello HelloWorld 
Your graphic is actually a bitmap image embedded in your pdf... which program did you use to render it?.... sorry, I was reading quick... maybe it has an option to use vector format... The Gradient mesh option is used for vector shapes, so I believe it's not important for your design.
... How interesting...!!
I want to investigate more this...
WTF????
It's a bitmap image of 21x21 pixels????
 , and of 950 bytes???
Your graphic is actually a bitmap image embedded in your pdf... which program did you use to render it?.... sorry, I was reading quick... maybe it has an option to use vector format... The Gradient mesh option is used for vector shapes, so I believe it's not important for your design.
... How interesting...!!
I want to investigate more this...
WTF????
It's a bitmap image of 21x21 pixels????

- img.png (950 Bytes) Viewed 2672 times
Last edited by hulf2012 on Sun Mar 27, 2016 6:35 am, edited 2 times in total.
If you have problems:
1.- Post a sample (or samples) of your file please.
2.- Please check here:
http://tavmjong.free.fr/INKSCAPE/MANUAL/html/index.html
3.- If you manage to solve your problem, please post here your solution.
1.- Post a sample (or samples) of your file please.
2.- Please check here:
http://tavmjong.free.fr/INKSCAPE/MANUAL/html/index.html
3.- If you manage to solve your problem, please post here your solution.
Re: Disable gradient mesh approximation on PDF input
HelloWorld wrote:Is there a way to disable this "gradient mesh approximation" feature?
Like this way?
Re: Disable gradient mesh approximation on PDF input
Wow...
I found a solution... It's tricky but simple...
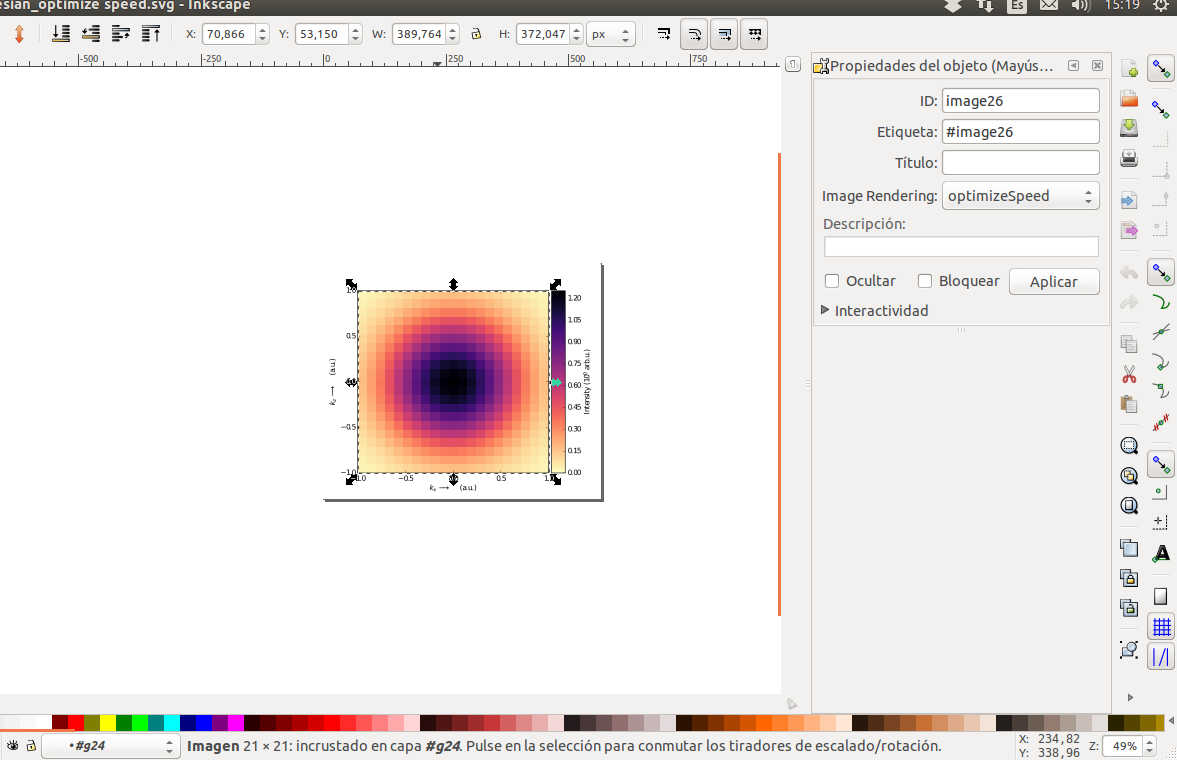
Find a way to only select the image of your graphic. Make a right click and select Image properties. A panel will open with an option for image rendering. Select: optimize speed.
I found a solution... It's tricky but simple...
Find a way to only select the image of your graphic. Make a right click and select Image properties. A panel will open with an option for image rendering. Select: optimize speed.
- screen 00.jpg (59.85 KiB) Viewed 2671 times
If you have problems:
1.- Post a sample (or samples) of your file please.
2.- Please check here:
http://tavmjong.free.fr/INKSCAPE/MANUAL/html/index.html
3.- If you manage to solve your problem, please post here your solution.
1.- Post a sample (or samples) of your file please.
2.- Please check here:
http://tavmjong.free.fr/INKSCAPE/MANUAL/html/index.html
3.- If you manage to solve your problem, please post here your solution.
-
HelloWorld
- Posts: 3
- Joined: Sun Mar 27, 2016 4:02 am
Re: Disable gradient mesh approximation on PDF input
Hey hulf,
thanks for your tip with the vector graphics! I generated the PDF above with the imshow() and savefig() functions of matplotlib.
This function is also capable of saving figures in *.svg format. I already tried that before which gave me the same issue as with the PDF.
I was able to fix that by setting the interpolation method to 'nearest' instead of 'none'. Seems like if the interpolation method is set to 'none' python will
use some internal default settings, and these settings seem to be different for imshow()/show() and savefig() !
Whatsoever, problem solved! Thanks for your GREAT tip!
Cheers!
-
HelloWorld
- Posts: 3
- Joined: Sun Mar 27, 2016 4:02 am
Re: Disable gradient mesh approximation on PDF input
hulf2012 wrote:WTF????
It's a bitmap image of 21x21 pixels????
Yes, but i would not say it's an "image". It is actually data coming from numerical simulations. So the 21x21 pixels you see are actually 21x21 data points that are linked to a spatial grid behind the scenes. Python will use the data points and the grid information to scale the image according to the grid using a nearest neighbour interpolation.
Cheers
Re: Disable gradient mesh approximation on PDF input
That's a common problem with matplotlib... It creates teeny tiny bitmap images, that Inkscape tries to smoothe out because they are blown up to a huge size.
Inkscape needs to either be told to not do the smoothing, and render the image 'blocky', or you need to vectorize the bitmap, or just find out if matplotlib is able to create a grid of vector rectangles as an output instead of pixels.
Inkscape needs to either be told to not do the smoothing, and render the image 'blocky', or you need to vectorize the bitmap, or just find out if matplotlib is able to create a grid of vector rectangles as an output instead of pixels.
Something doesn't work? - Keeping an eye on the status bar can save you a lot of time!
Inkscape FAQ - Learning Resources - Website with tutorials (German and English)
Inkscape FAQ - Learning Resources - Website with tutorials (German and English)
Re: Disable gradient mesh approximation on PDF input
It's a problem, but also it's a way to compress information.
I don't know mathplotlib. But if there is a way to manipulate the svg code generated by the program, the solution can be extended to add and attribute, or an style element to the SVG code. The attribute is image-rendering:
https://developer.mozilla.org/en-US/doc ... -rendering
I don't know mathplotlib. But if there is a way to manipulate the svg code generated by the program, the solution can be extended to add and attribute, or an style element to the SVG code. The attribute is image-rendering:
https://developer.mozilla.org/en-US/doc ... -rendering
If you have problems:
1.- Post a sample (or samples) of your file please.
2.- Please check here:
http://tavmjong.free.fr/INKSCAPE/MANUAL/html/index.html
3.- If you manage to solve your problem, please post here your solution.
1.- Post a sample (or samples) of your file please.
2.- Please check here:
http://tavmjong.free.fr/INKSCAPE/MANUAL/html/index.html
3.- If you manage to solve your problem, please post here your solution.