First of all thank you very much to everyone involved in creating and maintaining this wonderful tool. I'm a graduate economics student (UK).
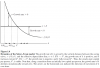
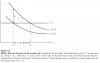
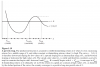
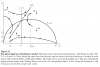
I need some help regarding drawing some concave functions. Here are some example of what type of things I'd like to draw:
Initially, I was thinking of drawing the graphs in LaTeX, but then I found out about Incscape, allowing me to concentrate on my main work.
If some kind souls can help me by providing me some instructions and one or two example I'd really appreciate.
Regards
Mohammad
 or Pen
  tools, then Node tool
  to edit the paths.